
Retailers have become expert data collectors online: they measure every click, scroll, and purchase path. That precision has made e-commerce optimizable, predictable, and measurable. Yet the physical store — where many retailers still earn most of their revenue — remains surprisingly opaque. In the same way that web analytics explain the digital journey; in-store audience insights explain the physical one. Together they create a full picture of shopper intent and behavior.
This post clarifies what each discipline measures, where gaps exist, and why combining people counting and in-store audience insights gives retailers the e-commerce-like visibility they need to improve performance.
Why Web Analytics Alone Do Not Explain In-Store Behavior
Web analytics are brilliant at tracking interactions with web pages: page views, click-through rates, bounce rates, session length and conversion paths. They reveal which digital campaigns bring traffic, how users navigate product pages, and where drop-off happens in an online checkout funnel.
 But that data stops at the physical storefront. Web analytics cannot show:
- Footfall: How many people enter a store.
- Dwell time: How long shoppers linger in a department or at a display.
- Product engagement: Who stops to examine an item, pick it up, or compare SKUs.
- Zone-level movement: The physical path a shopper takes through aisles and displays.
- Real-time occupancy and queue behavior: How busy a store or register is at any moment.
The Gap Between Online Research and In-Store Action
A large share of shoppers research online before visiting a store — browsing reviews, comparing prices, and checking stock. Web analytics capture this prior intent. What these tools cannot capture is the moment of truth in-store: Did a shopper who researched a product online actually find it on the shelf, try it, hesitate, or abandon it at the register? Without physical-world measurement, retailers make staffing, merchandising and campaign decisions based on incomplete information.
What In-Store Audience Insights Reveal That Web Analytics Cannot
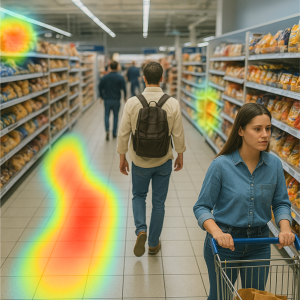
Today’s savvy retailers utilize a combination of non-intrusive sensors and analytics to gain in-store audience insights based on the measurement of real shopper behavior in physical environments. These systems anonymously measure the total count of people entering the store, movement patterns, dwell times, zone engagement and conversion rates — all while respecting privacy and compliance obligations. The result is a reliable, objective view of what happens after the customer crosses the door.
Key Metrics In-Store Retail Analytics Capture
- People counting: Accurate entry and exit numbers that underpin conversion calculations.
- Footfall analytics: Hourly, daily and seasonal traffic trends for each store.
- Dwell time measurement: How long shoppers spend in specific areas or near fixtures.
- Pathing and shopper flow: Common routes through the store and heatmaps of high-traffic zones.
- Zone engagement: Which displays or product areas attract attention and which are ignored.
- Queue analytics: Real-time and historical data on checkout waits that affect conversions.
- In-store conversion: Sales divided by traffic, by hour and by zone.
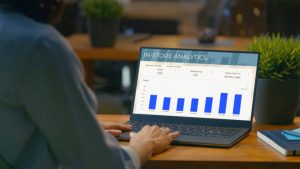
These metrics turn the store into a testable environment the way web analytics have turned websites into optimizable assets. Learn more about footfall analytics and why it matters in retail in the Walkbase blog. For technology-driven store measurement and orchestration, see Walkbase TREQ.
People Counting: The Foundation of Accurate Retail Analytics
Why does head count matter for in-store metrics? People counting is the base layer for all in-store measurements. Without a trustworthy count of who entered, conversion calculations are unreliable. Accurate entrance counts allow retailers to:
- Determine true conversion (sales ÷ traffic).
- Measure the lift from a promotional display or in-store campaign.
- Optimize staffing: Aligning adequate staff for peak and slow periods to reduce cost and improve service.
- Benchmark store performance across regions and formats.
 How People Counting Fits Into the Bigger Insight Picture
When people counting is combined with dwell, pathing and zone engagement data, it enables granular analysis: which campaigns drove more attention, where shoppers diverted from planned routes, and how layout changes affect purchasing. People counting anchors all downstream KPIs and makes in-store analytics comparable across time and locations.
In-Store Insights vs Web Analytics: A Side-by-Side Comparison
Now that we’ve discussed in-store insights, let’s take a closer look at how in-store insights and web analytics help retailers understand their audience.
Below is a simple comparison to highlight where each method contributes:
| Measurement Type | Web Analytics | In-Store Audience Insights |
| Traffic Source | Yes | No |
| Page Behavior | Yes | No |
| Footfall | No | Yes |
| People Counting | No | Yes |
| Shopper Flow | No | Yes |
| Product Engagement | No | Yes |
| Real-Time Occupancy | No | Yes |
| In-Store Conversion | No | Yes |
Use this table as a reminder: web analytics reveal digital intent and behavior up to the store door. In-store audience insights translate that intent into physical action and in-store conversions.
How Retailers Use In-Store Audience Insights to Improve Store Performance
Improve Staffing With Footfall Patterns
When traffic patterns are visible by hour and by day, retailers can align staff schedules to actual demand. That reduces overstaffing on slow days and eliminates service gaps during peaks — both of which improve customer experience and profitability.
Reduce Queue Times With Real-Time Occupancy
Real-time occupancy and queue analytics enable proactive intervention: open an extra register, redeploy staff to busy zones, or trigger digital signage to redirect customers. Shorter queues increase conversion and reduce abandonments.
 Validate In-Store Campaigns & Retail Media
Retail media and in-store campaigns need measurable lift. By combining people counting with zone engagement and dwell analytics, retailers can quantify how a campaign or digital screen influenced attention and sales. (See our blog about Measuring the In-Store Retail Media Experience for approaches to measuring campaign impact.) Walkbase’s retail media solutions make it possible to tie physical engagement to campaign performance.
Optimize Layout Based on Shopper Flow
Heatmaps and pathing data reveal natural shopper routes and chokepoints. Use these insights to place high-margin products in high-footfall zones, redesign aisles to ease flow, or relocate displays that cause congestion. These small, data-led changes often yield measurable uplifts in sales.
Bringing the Two Journeys Together
Retailers succeed when they connect digital intent to physical behavior. Web analytics tells you who showed interest and where they came from; in-store audience insights tell you what those customers actually did once they arrived.
People counting provides the essential baseline — without it, conversion and campaign lift are guesswork. Combining both data sources creates an omnichannel measurement strategy that supports smarter decisions around staffing, merchandising, promotions and store design.
Want to dig deeper? Explore Walkbase TREQ to see how sensor-based analytics drive real-time in-store intelligence, and learn how retail media measurement can validate campaign performance on the shop floor via our Retail Media page. For a primer on traffic and visitor measurement, read our post on What Is Footfall Analytics and Why It Matters in Retail.
Final Thought: Make the Store Measurable
Treat your store like you treat your website: instrument it, measure it, test it, and iterate. With privacy-safe, non-intrusive in-store audience insights and accurate people counting, retailers are finally able to close the measurement gap between digital and physical journeys — and unlock new sources of efficiency and revenue.